适用于 SwiftUI 的图表和绘图库
SwiftUICharts
SwiftUI 的图表/绘图库。适用于 macOS、iOS、watchOS 和 tvOS,并内置辅助功能和本地化功能。
开发版本 3 时,API 具有更 SwiftUI 的感觉。
折线图
折线图

使用数据模型。LineChartData
LineChart(chartData: LineChartData)
填充折线图

使用数据模型。LineChartData
FilledLineChart(chartData: LineChartData)
Multi Line Chart

Uses data model.MultiLineChartData
MultiLineChart(chartData: MultiLineChartData)
Ranged Line Chart

Uses data model.RangedLineChart
RangedLineChart(chartData: RangedLineChartData)
Bar Charts
Bar Chart

Uses data model.BarChartData
BarChart(chartData: BarChartData)
Range Bar Chart

Uses data model.RangedBarChartData
RangedBarChart(chartData: RangedBarChartData)
Grouped Bar Chart

Uses data model.GroupedBarChartData
GroupedBarChart(chartData: GroupedBarChartData)
Stacked Bar Chart

Uses data model.StackedBarChartData
StackedBarChart(chartData: StackedBarChartData)
Pie Charts
Pie Chart

Uses data model.PieChartData
PieChart(chartData: PieChartData)
Doughnut Chart

Uses data model.DoughnutChartData
DoughnutChart(chartData: DoughnutChartData)
Documentation
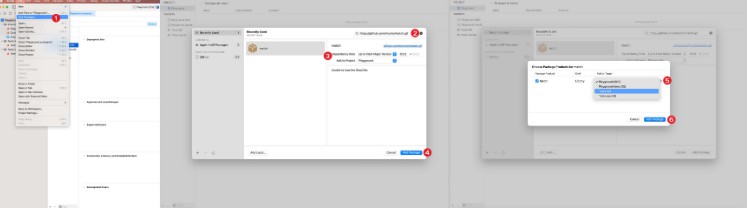
Installation
Swift Package Manager
File > Swift Packages > Add Package Dependency...
import SwiftUICharts
If you have trouble with views not updating correctly, add to your View..id()
LineChart(chartData: LineChartData)
    .id(LineChartData.id)
The order of the view modifiers is some what important as the modifiers are various types of stacks that wrap around the previous views.
All Chart Types
Touch Overlay
Detects input either from touch of pointer. Finds the nearest data point and displays the relevent information where specified.
The location of the info box is set in .ChartStyle -> infoBoxPlacement
.touchOverlay(chartData: CTChartData, specifier: String, unit: TouchUnit)
- chartData: Chart data model.
- specifier: Decimal precision for labels.
- unit: Unit to put before or after the value.
Setup within Chart Data –> Chart Style
Info Box
Displays the information from Touch Overlay if is set to .InfoBoxPlacement.infoBox
The location of the info box is set in .ChartStyle -> infoBoxPlacement
.infoBox(chartData: CTChartData)
- chartData: Chart data model.
Floating Info Box
Displays the information from Touch Overlay if is set to .InfoBoxPlacement.floating
The location of the info box is set in .ChartStyle -> infoBoxPlacement
.floatingInfoBox(chartData: CTChartData)
- chartData: Chart data model.
Header Box
Displays the metadata about the chart, set in Chart Data -> ChartMetadata
Displays the information from Touch Overlay if is set to .InfoBoxPlacement.header
The location of the info box is set in .ChartStyle -> infoBoxPlacement
.headerBox(chartData: CTChartData)
Legends
Displays legends.
.legends()
Lays out markers over each of the data point.
Line and Bar Charts
Average Line
Shows a marker line at the average of all the data points.
.averageLine(chartData: CTLineBarChartDataProtocol,
             markerName: "Average",
             labelPosition: .yAxis(specifier: "%.0f"),
             lineColour: .primary,
             strokeStyle: StrokeStyle(lineWidth: 3, dash: [5,10]))
- chartData: Chart data model.
- markerName: Title of marker, for the legend.
- labelPosition: Option to display the markers’ value inline with the marker.
- labelColour: Colour of the Text.
- labelBackground: Colour of the background.
- lineColour: Line Colour.
- strokeStyle: Style of Stroke.
Y Axis Point Of Interest
Configurable Point of interest
.yAxisPOI(chartData: CTLineBarChartDataProtocol,
          markerName: "Marker",
          markerValue: 123,
          labelPosition: .center(specifier: "%.0f"),
          labelColour: Color.black,
          labelBackground: Color.orange,
          lineColour: Color.orange,
          strokeStyle: StrokeStyle(lineWidth: 3, dash: [5,10]))
- chartData: Chart data model.
- markerName: Title of marker, for the legend.
- markerValue: Value to mark
- labelPosition: Option to display the markers’ value inline with the marker.
- labelColour: Colour of the Text.
- labelBackground: Colour of the background.
- lineColour: Line Colour.
- strokeStyle: Style of Stroke.
- Returns: A new view containing the chart with a marker line at a specified value.
X Axis Grid
Adds vertical lines along the X axis.
.xAxisGrid(chartData: CTLineBarChartDataProtocol)
Setup within .ChartData -> ChartStyle
Y Axis Grid
Adds horizontal lines along the Y axis.
.yAxisGrid(chartData: CTLineBarChartDataProtocol)
Setup within .ChartData -> ChartStyle
X Axis Labels
Labels for the X axis.
.xAxisLabels(chartData: CTLineBarChartDataProtocol)
Setup within .ChartData -> ChartStyle
Y Axis Labels
Automatically generated labels for the Y axis
.yAxisLabels(chartData: CTLineBarChartDataProtocol, specifier: "%.0f")
- specifier: Decimal precision specifier.
Setup within .ChartData -> ChartStyle
yAxisLabelType:
case numeric // Auto generated, numeric labels.
case custom // Custom labels array
Custom is set from ChartData -> yAxisLabels
Linear Trend Line
A line across the chart to show the trend in the data.
.linearTrendLine(chartData: CTLineBarChartDataProtocol,
                 firstValue: Double,
                 lastValue: Double,
                 lineColour: ColourStyle,
                 strokeStyle: StrokeStyle)
Line Charts
Point Markers
Lays out markers over each of the data point.
.pointMarkers(chartData: CTLineChartDataProtocol)
Setup within .Data Set -> PointStyle
Filled Top Line
Adds an independent line on top of FilledLineChart.
.filledTopLine(chartData: LineChartData,
               lineColour: ColourStyle,
               strokeStyle: StrokeStyle)
Allows for a hard line over the data point with a semi opaque fill.
Examples
Line Chart
struct LineChartDemoView: View {

    let data : LineChartData = weekOfData()

    var body: some View {
        VStack {
            LineChart(chartData: data)
                .pointMarkers(chartData: data)
                .touchOverlay(chartData: data, specifier: "%.0f")
                .yAxisPOI(chartData: data,
                          markerName: "Step Count Aim",
                          markerValue: 15_000,
                          labelPosition: .center(specifier: "%.0f"),
                          labelColour: Color.black,
                          labelBackground: Color(red: 1.0, green: 0.75, blue: 0.25),
                          lineColour: Color(red: 1.0, green: 0.75, blue: 0.25),
                          strokeStyle: StrokeStyle(lineWidth: 3, dash: [5,10]))
                .yAxisPOI(chartData: data,
                          markerName: "Minimum Recommended",
                          markerValue: 10_000,
                          labelPosition: .center(specifier: "%.0f"),
                          labelColour: Color.white,
                          labelBackground: Color(red: 0.25, green: 0.75, blue: 1.0),
                          lineColour: Color(red: 0.25, green: 0.75, blue: 1.0),
                          strokeStyle: StrokeStyle(lineWidth: 3, dash: [5,10]))
                .averageLine(chartData: data,
                             strokeStyle: StrokeStyle(lineWidth: 3, dash: [5,10]))
                .xAxisGrid(chartData: data)
                .yAxisGrid(chartData: data)
                .xAxisLabels(chartData: data)
                .yAxisLabels(chartData: data)
                .infoBox(chartData: data)
                .headerBox(chartData: data)
                .legends(chartData: data, columns: [GridItem(.flexible()), GridItem(.flexible())])
                .id(data.id)
                .frame(minWidth: 150, maxWidth: 900, minHeight: 150, idealHeight: 250, maxHeight: 400, alignment: .center)
        }
        .navigationTitle("Week of Data")
    }

    static func weekOfData() -> LineChartData {
        let data = LineDataSet(dataPoints: [
            LineChartDataPoint(value: 12000, xAxisLabel: "M", description: "Monday"),
            LineChartDataPoint(value: 10000, xAxisLabel: "T", description: "Tuesday"),
            LineChartDataPoint(value: 8000,  xAxisLabel: "W", description: "Wednesday"),
            LineChartDataPoint(value: 17500, xAxisLabel: "T", description: "Thursday"),
            LineChartDataPoint(value: 16000, xAxisLabel: "F", description: "Friday"),
            LineChartDataPoint(value: 11000, xAxisLabel: "S", description: "Saturday"),
            LineChartDataPoint(value: 9000,  xAxisLabel: "S", description: "Sunday")
        ],
        legendTitle: "Steps",
        pointStyle: PointStyle(),
        style: LineStyle(lineColour: ColourStyle(colour: .red), lineType: .curvedLine))

        let metadata   = ChartMetadata(title: "Step Count", subtitle: "Over a Week")

        let gridStyle  = GridStyle(numberOfLines: 7,
                                   lineColour   : Color(.lightGray).opacity(0.5),
                                   lineWidth    : 1,
                                   dash         : [8],
                                   dashPhase    : 0)

        let chartStyle = LineChartStyle(infoBoxPlacement    : .infoBox(isStatic: false),
                                        infoBoxBorderColour : Color.primary,
                                        infoBoxBorderStyle  : StrokeStyle(lineWidth: 1),

                                        markerType          : .vertical(attachment: .line(dot: .style(DotStyle()))),

                                        xAxisGridStyle      : gridStyle,
                                        xAxisLabelPosition  : .bottom,
                                        xAxisLabelColour    : Color.primary,
                                        xAxisLabelsFrom     : .dataPoint(rotation: .degrees(0)),

                                        yAxisGridStyle      : gridStyle,
                                        yAxisLabelPosition  : .leading,
                                        yAxisLabelColour    : Color.primary,
                                        yAxisNumberOfLabels : 7,

                                        baseline            : .minimumWithMaximum(of: 5000),
                                        topLine             : .maximum(of: 20000),

                                        globalAnimation     : .easeOut(duration: 1))

        return LineChartData(dataSets       : data,
                             metadata       : metadata,
                             chartStyle     : chartStyle)

    }
}
Accessibility
Inside certain elements are additional tags to help describe the chart for VoiceOver.
See Localization of Accessibility
Localization
All labels support localization. There are, however, some hidden labels that are there to support VoiceOver. See Localization of Accessibility
Localization of Accessibility
See the localization demo in the Demo Project.
Voice over description of a datapoint when the user touches the area closest to the data point.
The VoiceOver will say .<chart title>, <data point value>, <data point description>
"%@ <local_description_of_a_data_point>" = "%@, <Description of a data point>";
Read out before a .
The VoiceOver will say .poiMarker<p o i marker>, <marker legend title>, <marker value>
"P-O-I-Marker" = "P O I Marker";
"Average" = "Average";
Voice over description of a .
The VoiceOver will say .poiMarker<P-O-I-Marker>, <marker legend title>, <marker value>
"<local_marker_legend_title> %@" = "local_marker_legend_title, %@";
Read out before a .
The VoiceOver will say .axisLabel<axisLabel>, <marker value>
"X-Axis-Label" = "X Axis Label";
"Y-Axis-Label" = "Y Axis Label";
Read out before a .
The VoiceOver will say .legend<chart type legend>, <legend title>
"Line-Chart-Legend" = "Line Chart Legend";
"P-O-I-Marker-Legend" = "P O I Marker Legend";
"Bar-Chart-Legend" = "Bar Chart Legend";
"P-O-I-Marker-Legend" = "P O I Marker Legend";
"Pie-Chart-Legend" = "Pie Chart Legend";
"P-O-I-Marker-Legend" = "P O I Marker Legend";